Data Analysis and Business Intelligence
Data Analysis and Business Intelligence (BI) are critical components of modern business strategy, providing insights that drive decision-making and strategic planning. It is much more than software and describes a set of processes and technologies for simplifying and enhancing the use of information within a Organisation. In BI data is gathered from the IT systems, whether they be ERP or CRM systems, or from Excel spreadsheets and other personal productivity tools. Data is cleaned, standardised and then presented to business users in a friendly way.


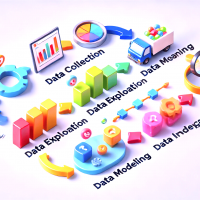
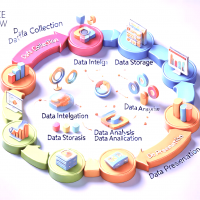
Data Analysis involves inspecting, cleansing, transforming, and modeling data to discover useful information, draw conclusions, and support decision-making. Key steps include:
1. Data Collection: Gathering raw data from various sources such as databases, spreadsheets, and APIs.
2.Data Cleaning: Removing or correcting inaccurate records from a dataset.
3.Data Transformation: Converting data into a usable format, which might include normalization, aggregation, or encoding.
4.Data Modeling: Using statistical and machine learning models to analyze and interpret data.
5Visualization: Creating graphs, charts, and dashboards to represent data insights visually.

Business Intelligence, when properly implemented and used, delivers many benefits. Some of the key advantages include:
Alignment of an organisation around a consistent set of Key Performance Indicators (KPIs) and Metrics
1.Quicker, fact-based decision making
2.Simplified graphical presentation of KPIs and metrics
3.Reliable presentation of information (‘One version of the truth’)
4.Combination of multiple data sources (ERP,CRM, Spreadsheets, Budgets…)
5.Faster collection and dissemination of information
Business Intelligence (BI) refers to the technology-driven process for analyzing data and presenting actionable information to help executives, managers, and other corporate end users make informed business decisions. BI encompasses:
Data Warehousing: Centralizing data from different sources into a single repository.
Data Mining: Discovering patterns and relationships in large datasets.
Reporting: Creating reports that summarize the data and findings.
Dashboards: Interactive tools that provide at-a-glance views of key performance indicators (KPIs) and metrics.
OLAP (Online Analytical Processing): Enabling complex queries and analysis of multidimensional data.

Python (with libraries like Pandas, NumPy, Matplotlib, Seaborn, Scikit-learn)
R (with packages like ggplot2, dplyr, caret)
SQL for database querying
Excel for simple data manipulation and analysis
Tools for Business Intelligence:
Tableau: For creating interactive and shareable dashboards.
Power BI: A Microsoft tool for data visualization and business analytics.
QlikView: For guided analytics and dashboard creation.
SAP BusinessObjects: For comprehensive reporting, analysis, and interactive dashboards.
Looker: For data exploration and business intelligence.

Integrating data analysis and BI involves using data analysis techniques to generate insights that are then presented through BI tools.
This integration helps organizations to:
Identify Trends and Patterns: Understand market trends, customer behavior, and operational performance.
Improve Decision Making: Make data-driven decisions to optimize business processes.
Enhance Efficiency: Identify bottlenecks and streamline operations.
Increase Competitiveness: Leverage insights for strategic advantage


